SUMMARY
To create contour plots from vector fields in ParaView, you can either adjust color maps for a contourf-like effect or extract vector components using the Calculator filter for precise contour lines. This process allows you to visualize specific vector components like X, Y, or Z in the contour graph.
INDUSTRY
Scientific Visualization & Computational Analysis
RESOURCES
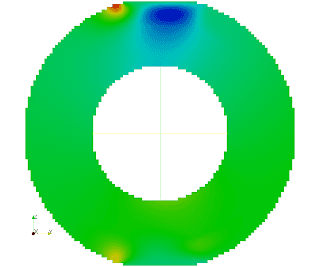
If you are working with a vector field (now on VectorField) in ParaView and you need to create a contour graph that requires contour levels instead of a continuous field (figure 1), then you have two options. First idea resembles the contourf command of MATLAB.

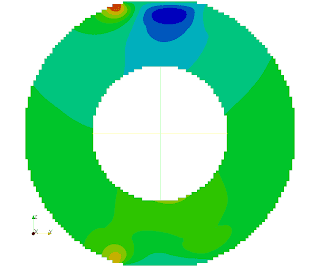
After the geometry is slice'd (though you can also create 3D contours), select your slice and locate your vector field in question under display tab. Later, select the component that you want to plot instead of the Magnitude option. In this post, I selected X direction. After the selection, it is a wise idea to click on Rescale to Data Range since the values on unit directions may vary compared to the magnitude of the vector. At this point you'll get a similar plot like in the first figure. Now, to create a contourf effect, select Edit Color Map... and in the dialog change the resolution to a small number like 10, instead of the default value, 256. You might also need to change the color map by clicking on the Choose Preset button and select Blue to Red for instance. After clicking the menu, the following plot is generated.

The levels are easy to detect. Also, for those of you familiar with Matlab, this operation is like contourf(VectorField,10).
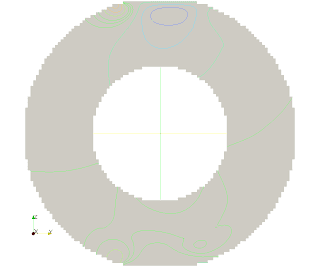
If you just need to create lines, instead of region to separate the levels, you need to work on the scalars i.e. on the components of the VectorField. For that, the components should be extracted. The vector can be decomposed by using the Calculator. It is listed under the Filters menu and also placed on the far left end of the toolbar. To extract the X component, we perform the following steps. First change the Result Array Name to let's say Xcomponent instead of Result. Then, click on iHat, v1.v2, buttons and select VectorField (or whatever the name you vector field has) under Vectors menu (bottom right-most button). When the order is correct, then the command string reads like: iHat.VectorField. This means, that our vector is dotted against the unit vector on i-direction (which means X-axis in our case). When we click on Apply, a new scalar variable, Xcomponent is created. Similarly, Y and Z components can be extracted using jHat and kHat functions, respectively. At this point, we are ready to create a contour graph of Xcomponent. Just select the contour filter. Now, the steps are the same as all other contour operations. Select Xcomponent from the Contour By list, click on Delete All to delete any existing or automatically generated contour levels (or just do nothing if the Isosurfaces field is empty) and select on New Range button and accept the values there by clicking OK. At the end, this is what we get:

Finally, I want to thank to Dr. Cyril Flaig allowing me to use the results of his thesis: Thanks Cyril!


